Utilities
There are three main resources provided by CRITT to help you analyze your data:
-
Shiny R Interface
-
tprdb-utilitiesPython library -
CRITT Academy code notebooks
Shiny R Interface
This is the best resource to get an immediate look at your data so you can begin to formulate ideas for what you want to subsequently analyze in greater depth.
Translation progression graphs are one of several methods for visualizing data from different tables. It depicts the temporal dynamics of the translation process by concurrently plotting partial information extracted from multiple unit tables.
Progression graphs are implemented using Shiny R, which is based on a reactive programming model. As a result, plots and tables are automatically updated whenever you change an input. Here is a link to the CRITT Shiny R interface:
Progression Graphs
The following are the steps for generating a progression graph.
First, you need to specify the user. The default User is PUBLIC, which provides access to a variety of public studies. To generate progression graphs for your private studies, change the user name to your own in the left panel.

Then use the drop-down menus to Select Study and Select Session, after which click Load selected session.
For demonstration purposes, we use session P01_T3 from the public study RUC17.
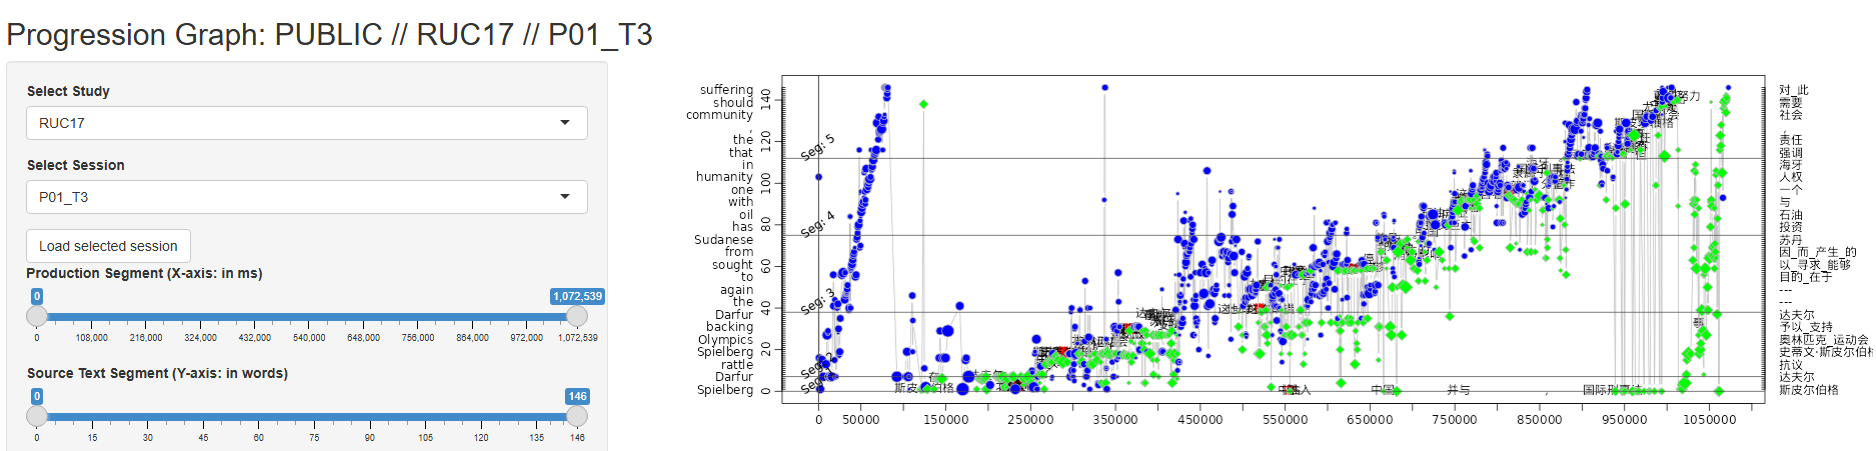
Note
·x-axis: time window (in milliseconds)
·y-axis: range of the ST and their aligned TT (in words)
·blue dots: fixations on the source text
·green dots: fixations on the target text
At this stage, the graph provides a general overview of the translator's behavior. Here, the x-axis represents the entire translation duration. The translator initially reads through the ST before beginning to produce the TT. Toward the end of the translation process, fixations are primarily on the TT, suggesting that the translator is reviewing the translation.
To set the time window and ST range, use the sliders to select the desired Production Duration and Source Text Segments.
For this example, the time window is set to 540,000–650,000 ms and the ST range to words 30–75. The resulting progression graph is shown below.
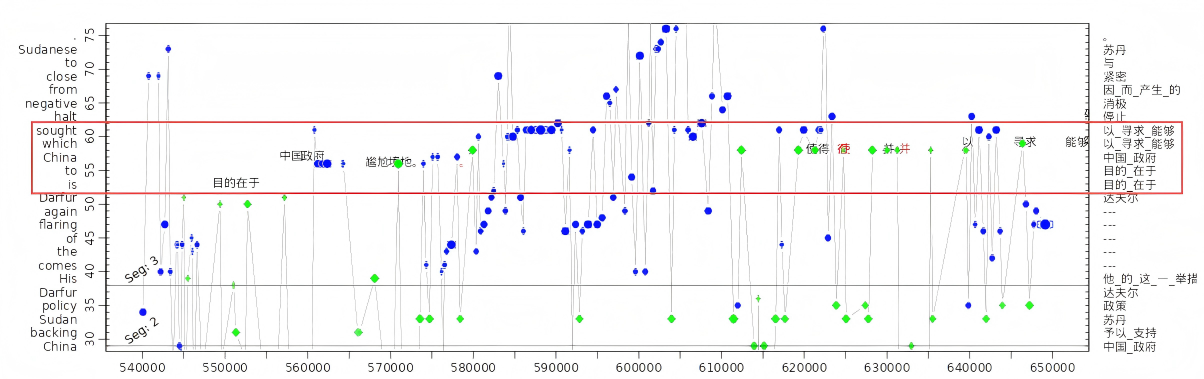
Note
·black characters: insertions
·red characters: deletions
By narrowing the time window and the ST range, the graph provides a finer-grained view of the translator's activity, showing that the translator focused on translating the words within the red boxed area, with a few deletions.
A useful complement to the progression graph is the set of data tables. To view a specific table, select it from the drop-down menu under Show Data Tables, where you can review different features. For detailed descriptions of the features, please refer to Table features in TPR-DB 3.0.
You can also customize the progression graph by selecting Show/Hide Items from the left panel to highlight specific features.
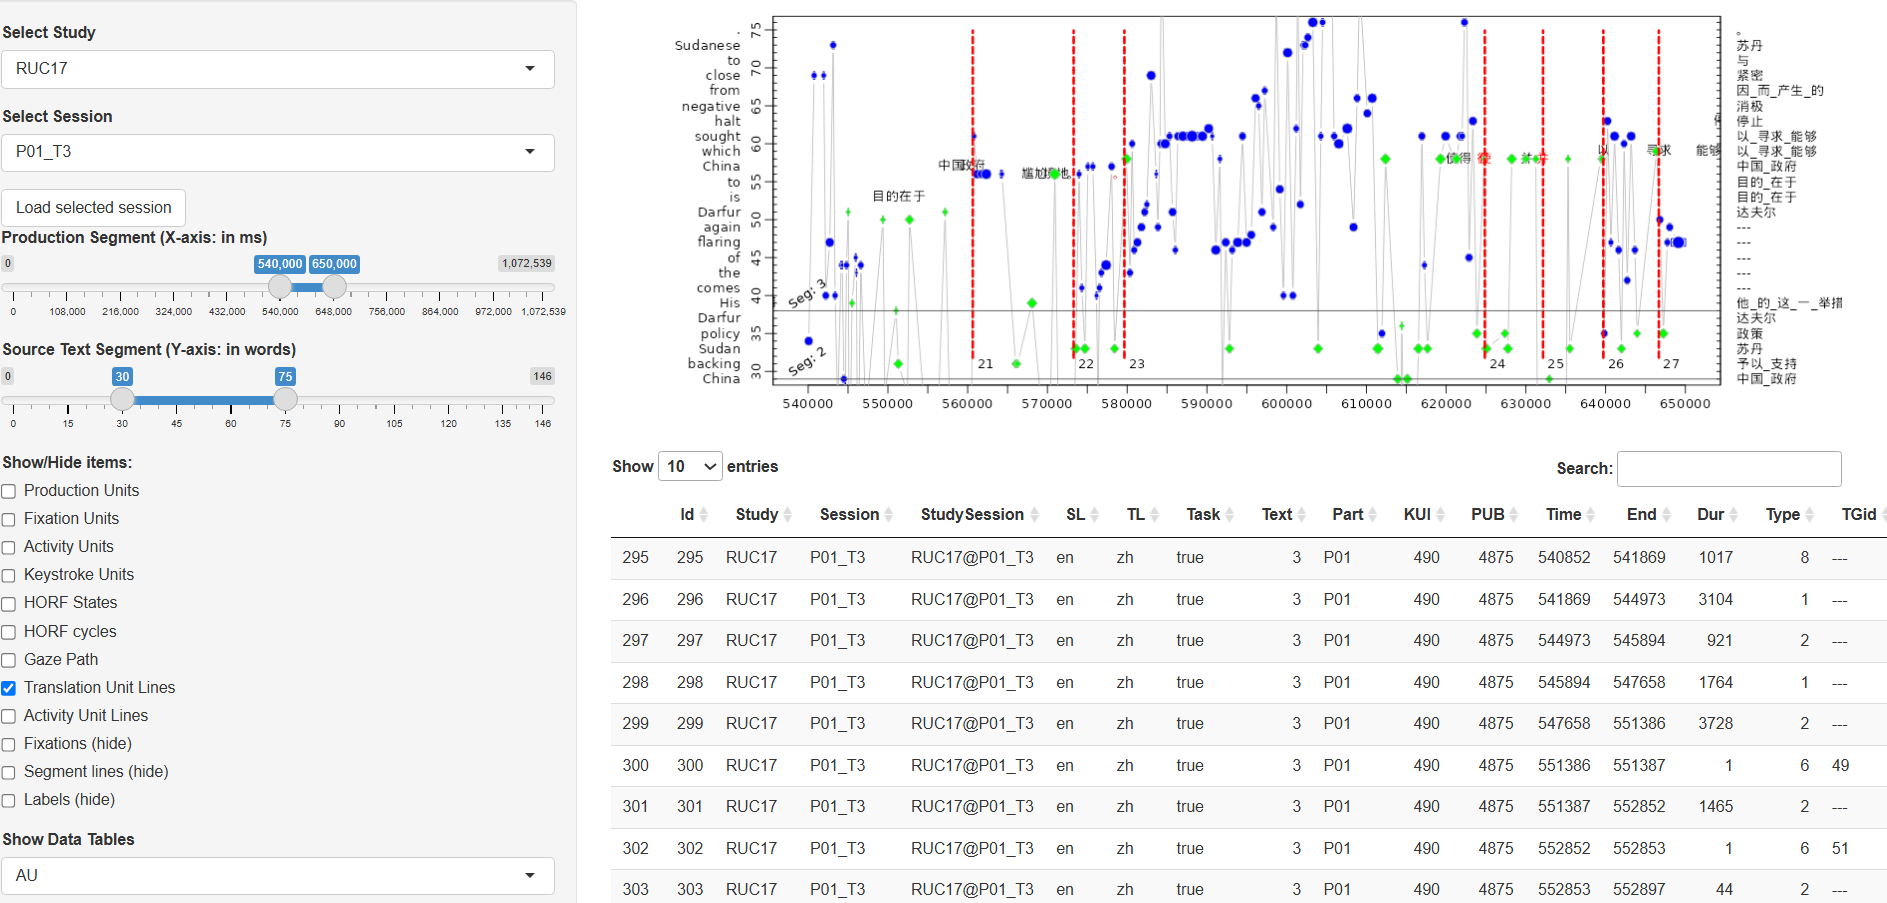
The progression graph above displays the TU lines (as shown by the red dashed line). Within the selected time window, there are six complete translation units (TUs 21–26). The table provides detailed AU features.
View Data Tables
From the Shiny R interface, you can also load any data table for the current session, and the rows of the data table will be limited to what is currently visible in the progression graph. This can be very useful for inspecting features associated with what you are zoomed in on in the progression graph.
tprdb-utilities (Python Library)
The Python library tprdb-utilities (Python Package Index | GitHub Repo) is a library that makes it easy to fetch data tables from specific TPR-DB studies and then read them into Pandas DataFrames for analysis.
fetcher
The fetcher module and its fetch_TPRDB_tables() function works with the TPR-DB web app's API to download/update data tables for a specific TPR-DB study, saving the most up-to-date tables in a location of your choosing.
Why fetch?
If you need to analyze the data from a location other than the CRITT TPR-DB Jupyter server, this module/function makes it super easy to download and organize the data tables 🤓
reader
The reader module and its read_TPRDB_tables() function takes the data tables you have downloaded for one or more studies you specify and reads them into a Pandas DataFrame object for subsequent analysis.
If working directly from the CRITT TPR-DB Jupyter server, the same module/function will also read the data directly from where the TPR-DB stores it.
transformer
The transformer module contains utility functions that will transform your data in various ways:
prep_parallel_texts(): this function prepares bitexts (source text and the target text of one participant) and/or tritexts (source text and the target texts of two participants), organized by segment, so that you can, for example, run automatic quality evaluation metrics like BLEU and COMET.recompute_pause_based_metrics(): this function will compute pause-based metrics (typing bursts (TB), typing gap (TB), and typing duration (TD))—calculated using a custom pause threshold you provide—and add them to your Segments DataFrame (based on SG tables)